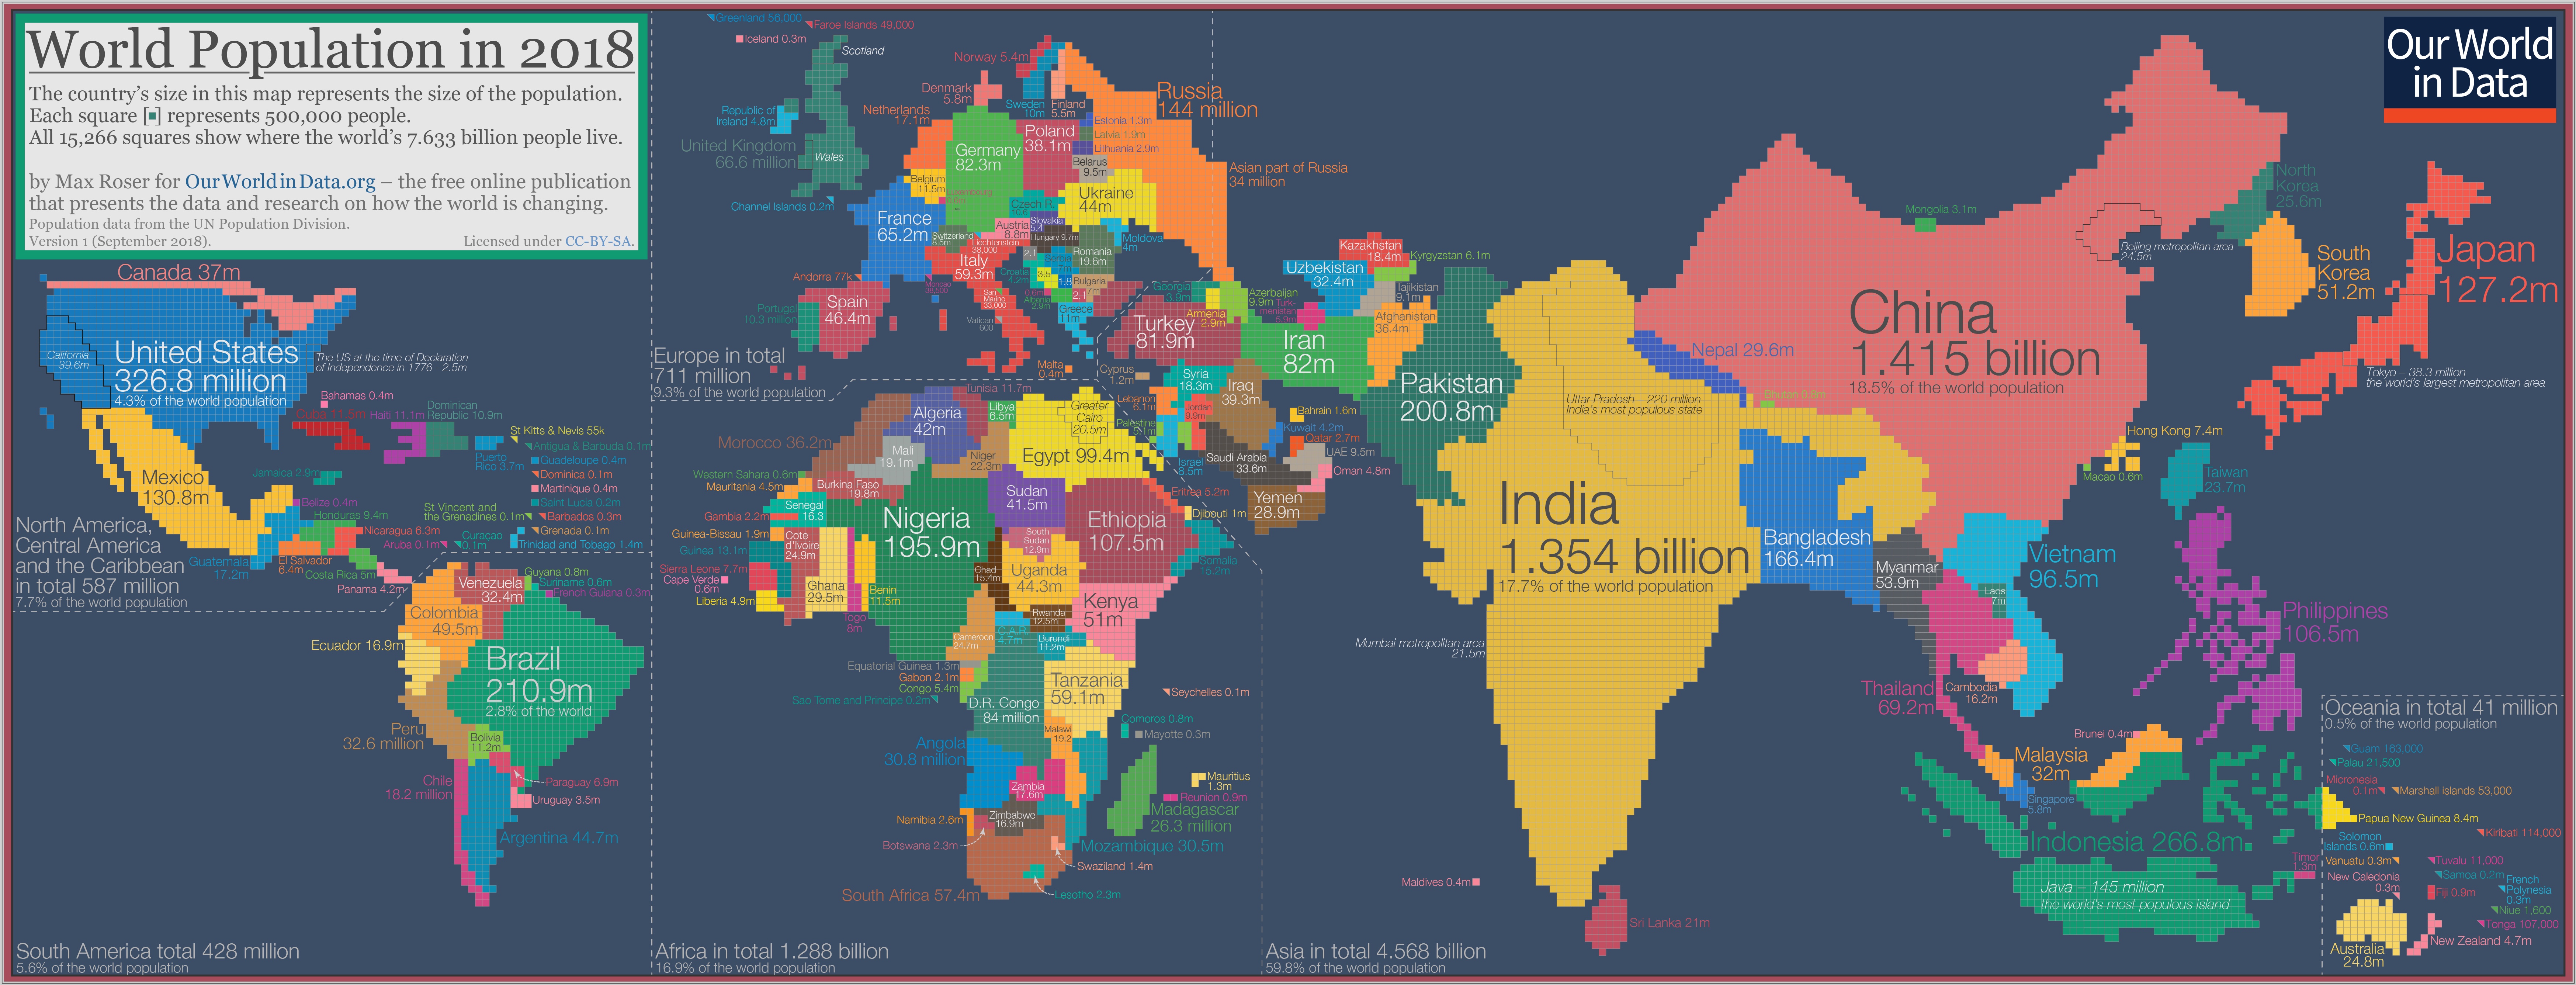
“The cartogram is made up of squares, each of which represents half a million people of a country’s population. The 11.5 million Belgians are represented by 23 squares; the 49.5 million Colombians are represented by 99 squares; the 1.415 billion people in China are represented by 2830 squares; and this year’s entire world population of 7.633 billion people is represented by the total sum of 15,266 squares.“
